
Power Query is undeniably one of my favorite features of Power BI, and for that matter, Excel. Power Query packs a powerful punch for performing ETL (extract, transform, and load) tasks and it’s user interface makes completing these tasks pretty simple without having to write any code. I won’t expand on all of the reasons why it’s a favorite in this article, but I will offer that Power Query shines in scenarios where robust, centralized data sources are not in use. Investing time to learn Power Query is well worth it for anyone working in Power BI as clean and well prepped data is vital for a successful data model and reporting. As you dive into Power Query, here are a few tips and features to power up your work.
Enable the Formula Bar
The formula bar in Power Query serves a similar purpose to the formula bar in Excel: to write and display code for a specific selection. In Power Query’s case, the formula bar shows M (short for Mashup language, the code underneath Power Query) for the selected applied step. While it is entirely possible to get what you need out of Power Query without writing any M, learning M expands Power Query’s capability allows you to go deeper. Enabling the formula bar is a great first step to learning M. When you use the UI to perform ETL tasks, Power Query automatically writes the M behind the scenes as a new applied step, and that M gets exposed in the formula bar. In other words, you can click your mouse to work with the data, the code gets written for you, and you get to see what was written!
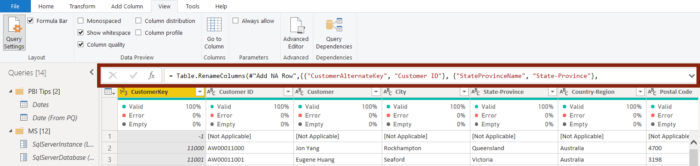
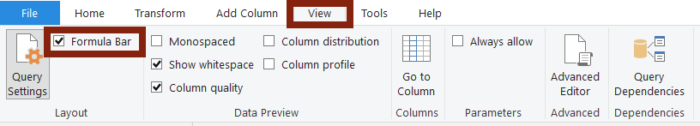
To enable the formula bar, navigate to the View ribbon in Power Query, then check the Formula Bar check box
Data Profiling Tools
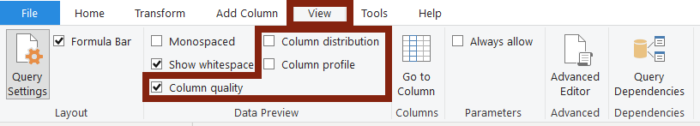
Power Query comes out of the box with a few data profiling tools to help you learn more about your data. These tools are enabled by navigating to the View ribbon in Power Query and checking “Column quality”, “Column distribution”, or “Column profile”. Each box can be checked individually or all together for a more complete data profile. Keep in mind that by default, Power Query profiles the top 1,000 rows of data. You can change this by selecting “Column profiling based on top 1000 rows” at the bottom of the Power Query window and selecting “Column profiling based on entire data set”.
Column Quality
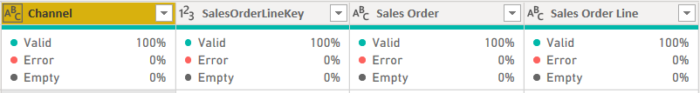
Column quality reveals whether the data is valid and ready to load or contains errors, or if any holes exist in the data. I like to keep “Column quality” enabled all the time, particularly to help spot errors. Errors can occur because of data type mismatches or transformations that are completed incorrectly. These errors can be tough to spot when they scatted few and far between in the data. Column quality helps to expose those errors making it faster to pinpoint the cause.
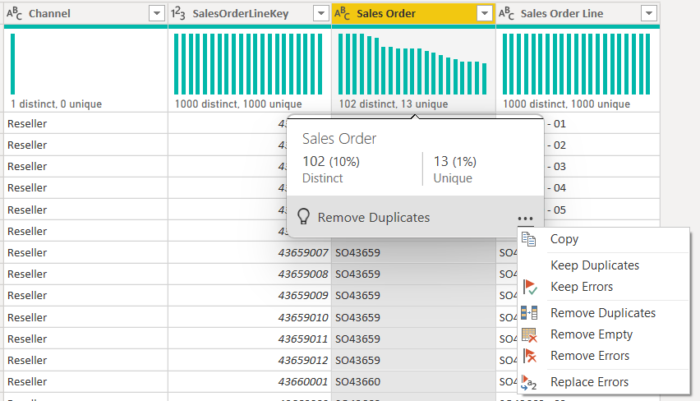
Column Distribution
Column distribution gives a sense of the shape of the data and helps to show any anomalies. The chart provides a compact view and you can hover over the chart to get to a menu of common transformations for cleaning up the data.
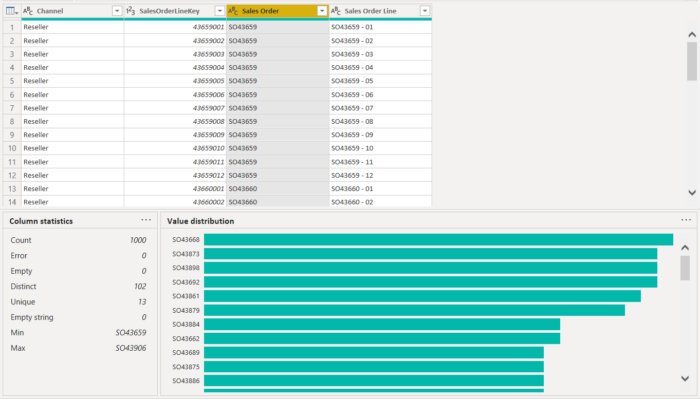
Column Profile
This tool is the most complete of the 3, offering a common data profiling stats and a larger view of the column’s value distribution. I prefer this view when looking at distribution as hovering over a bar in the chart chart at the bottom gives more detail on the distribution. This view is useful when working with a dataset that you aren’t very familiar with.
Copy and Paste Queries
As you work with Power Query more, you’ll find that you want to reuse queries across different reporting or data model solutions. Power Query makes this easy. A query can be ported from one solution to another by copying and pasting directly from the Queries pane in one Power Query window to the Queries pane in a different Power Query window. Simply right click a query, choose “Copy”, navigate to another Power Query window, right click in the Queries pane, and click “Paste. Every applied step, transformation, calculation, etc. gets duplicated. And what’s even better, you can port queries between Power Query in Power BI, Excel, and Visual Studio with success! Keep in mind that there may be some functionality variances depending on what versions of each software that you have installed. Also, after copying and pasting to a new solution, you may need to reauthenticate with your data sources.
In Closing
That’s it for this article. In the next article, we’ll dive a little deeper into Power Query and look at how you can build a date dimension table just using Power Query’s UI.