
In the previous 2 articles, I wrote about the importance of learning DAX and offered some of my favorite resources for working with DAX. This article will conclude the trio of tips and tricks articles on DAX. I’d like to suggest a few additional tips that will help you stay organized and make your life, and the lives of those who also work in your model, easier.
Add Comments
It doesn’t matter what language you’re coding in, comments are so helpful. Comments leave clues on why we coded what we did. Comments can indicate who made a change to the code and when. They can tie a code change to a ticket. Comments also allow us to disable sections of the code without deleting it. Whatever your motivation, add comments to your DAX!
DAX offers 3 options to add comments:
// Single line comment - anything on the same line after the two forward slashes will be commented out (indicated by green colored text) and not be executed with the rest of the DAX

-- Single line comment - anything on the same line after the two dashes will be commented out (indicated by green colored text) and not be executed with the rest of the DAX

/* Multiline comment */ - anything between the forward slashes and asterisks will be commented out (indicated by green colored text) and not be executed with the rest of the DAX.
Create a Metrics Table
Once you write more than a handful of measures, it’s easy to start losing track of them. Power BI (and SSAS for that matter) will allow DAX measures to be written and “be a part” of any table in the model. That can be convenient but also confusing and poses questions: Should the measure live in the table where the aggregated data comes from? What if the logic uses data from multiple tables, where should the measure land then? I asked these questions early on in my Power BI journey. You may not, and that’s completely ok. These questions got answered for me by creating a metrics table, a practice that I continue today in every model that I build. I find it handy to have the Metrics table as a singular spot to find any and all calculations, much like keeping tools organized in a toolbox. There’s not a hard and fast rule that requires the use of a metrics table, but you’ll find that most Power BI and SSAS Tabular gurus consider using a metrics table best practice.
So how do you create a metrics table? There are many ways to accomplish the task, here’s a simple way in Power BI that I like to use:
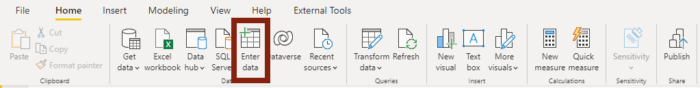
1. Click “Enter data”
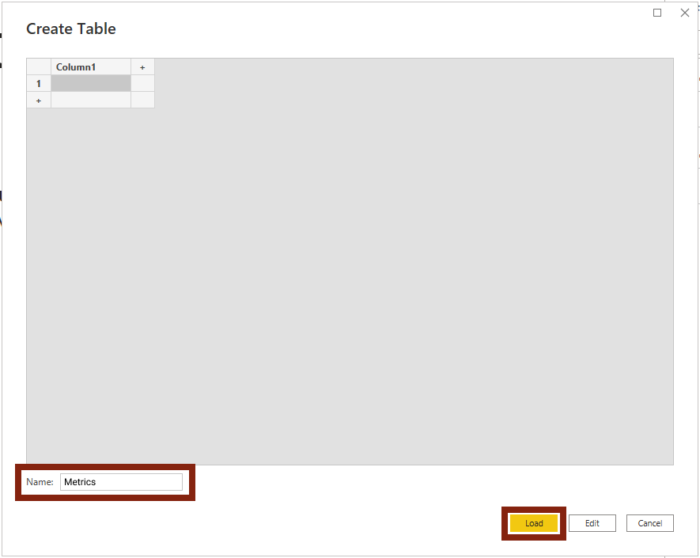
2. Name the table “Metrics” – again, no hard or fast rule here. Give the table a name that is meaningful to you and/or the developers, analysts, or team who will be utilizing the model. You can also change the column name if you’d like but, that’s unnecessary.
3. Click “Load”
4. Write a new metric that lives in this table, or move metrics to this table.
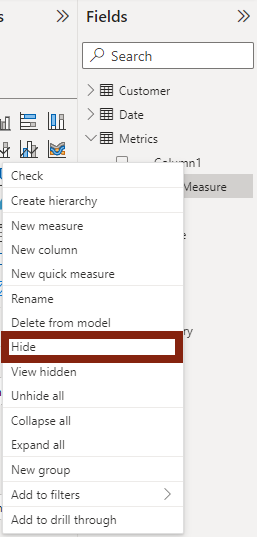
5. Hide Column1 (if you renamed the column in step 2, you’ll need to hide the column with the name you entered) – right click Column1 and click “Hide”.
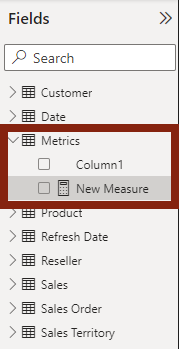
After hiding the column, Power BI will recognize that only DAX measures are present in the table and will change the icon next the the table name from the table icon to a calculator icon. The table will also jump to the top of the top of the table list in the Fields pane making it easy to find. Multiple metrics tables can exist in a model and if multiple are present, Power BI will organize them at the top of the the table list alphabetically.
Group Metrics in Display Folders
In smaller models and reports, a metrics table is usually sufficient to keep DAX measures organized. These models usually contain anywhere from 5 to 25 DAX measures; that’s pretty manageable. In the toolbox example, a small, single compartment works fine here. However, as a model grows, possibly even supporting several reports, it’s common to have 50, 75, or 100+ DAX measures in the model. Too many tools to dig through when you’re just looking for a screwdriver! This is where display folders come in. These folders group DAX measures together in collapsible folders that appear in the Fields pane. Now you’re upgrading to a tool chest with drawers to organize the different tools you own. Your creativity or use case is really the only limiter on how to utilize these display folders. A good starting point, however, is to group measures by their type: Base Measures, Helper Measures, Time Intelligence, Text and Titles, etc. The key is to make sure that you label the folder clearly to hint at the contents, just like naming folders in any file structure.
Implementing Display Folders is simple and can be accomplished both in Power BI and Tabular Editor. Here’s how:
Power BI
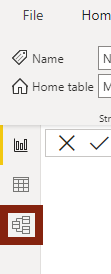
1. Navigate to the Model view
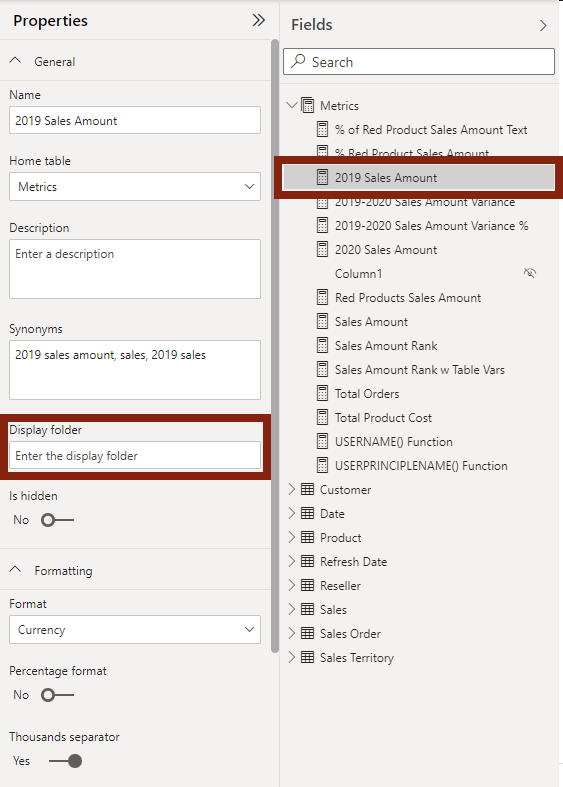
2. Expand the Properties and Fields panes if they aren’t already. Also, expand the Metrics table so that you can see all of the existing metrics. Then select the measure that you’d like to include in a display folder. In the Properties pane, enter the name of the Display folder that you’d like and that’s it!
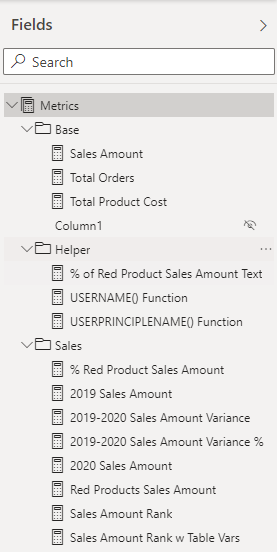
3. The measure will now appear in the Fields pane inside of the folder you just assigned it to. You can use the up and down carrots to open and close the folders as necessary.
NOTE: Power BI isn’t going to spell check or suggest previously used folder names. Whatever you type is what is going to be used. So, it’s worth double checking to make sure that each measure ends up in the intended folder.
Tabular Editor
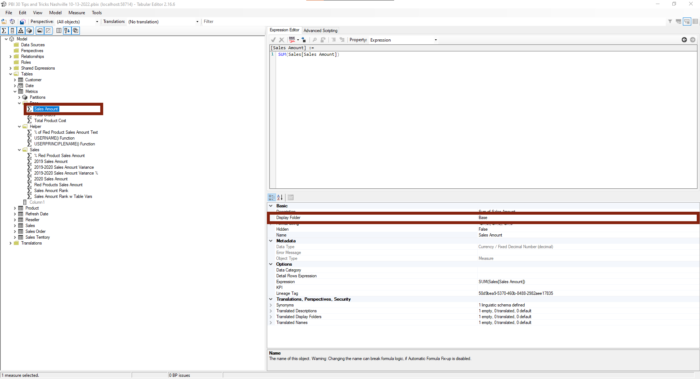
1. Launch Tabular Editor and and open your Power BI model. Expand Tables > Metrics (or the name of your metrics table) on the left hand side of the screen to see all of the existing DAX measures. In Tabular Editor, DAX measures are noted with the Greek Sigma icon.
2. Select the measure that you’d like to include in a display folder. In the properties to the bottom right hand side of the screen, enter the name of the Display folder that you’d like. The Display folder option falls under the Basic grouping of properties. That’s it!.
NOTE: Just like with Power BI, Tabular Editor isn’t going to spell check or suggest previously used folder names. Whatever you type is what is going to be used. So, it’s worth double checking to make sure that each measure ends up in the intended folder.
I have not formed a preference of using Power BI over Tabular Editor, or vice versa, for creating and maintaining Display folders. Both allow assigning measures to display folders in bulk and neither seems to have a performance benefit. It’s also worth noting that when implementing Display folders, not all metrics have to be in a folder. I commonly use Display folders to tuck measures away that have a specific use case and leave the others alone.
Final Thoughts
Organization is subjective, but I hope these tips illustrate the benefits of being organized with DAX. A little time when initially developing a model and a few extra seconds while expanding a model can save you a lot of time later! Let me tell you from experience, when a model gets large (or a DAX measure gets complex), organization goes a looooonnng way. And every other person who develops using your model will be glad.
In the next tips and tricks post, we’ll take a look at metadata in data models: formatting DAX measures, categorizing data, and cleaning up the model in preparation for reporting.