
In the previous post, we looked at options and features to power up your Power Query experience. I’d like to build on that in this article. Perhaps the greatest feature of Power Query is the UI. Any user can perform dozens of transformations, both basic and complex, with only mouse clicks and no need to write code. Let’s look at how we can utilize Power’s Query’s UI to build out one of the, if not the most, important dimension tables in a Power BI data model: the Date table.
But First…
Before we get to the how to, let’s set context with why. Why is a date table one of the, if not the most, important dimension tables in a Power BI data model?
- A date table enables use of DAX time intelligence functions. If you need to do any reporting over time periods, you’ll want to leverage the simplicity and efficiency of these functions.
- Business reporting is consumed across different date periods. A properly built date table contains multiple date attributes, such as calendar year, fiscal year (if applicable), quarter, month numbers, month names, and so on, accounting for whatever business requirements arise. Said a bit differently, a well built date table allows reports to be delivered at any time granularity required without needing to rebuild the report for each different period. It also allows you to give end users the option to slice and dice across any time period to their heart’s content.
- Dates are used on almost every fact table – not always, but frequently. Building a date table with the date attributes mentioned in the point above allows for these attributes to live in one table. In other words, you don’t need to have years, month names, or quarters on every table where a date exists.
Getting Started
There are a couple important points you need to consider when building a date table:
- The date table needs to contain sequential rows for each day. To say it differently, the table must include one row per day for the required time period. No skipping days!
- There needs to be one column in the table in a date data type. This column must contain unique dates and may not contain blanks or null values.
Microsoft’s Power BI documentation expands on these points here with some additional best practices and other suggestions for building out a date table.
I hinted at it in the opening paragraph at the article, but when I need to build a date table from scratch in Power BI, I like to use Power Query as opposed to DAX. I find that Power Query’s built in functions in the UI, along with the further customization of writing M, checks every box for date tables. To get started, Power Query needs a single column of date values in a date data type. In many applications, this single column of dates can come from a fact table in the model. In other scenarios, the dates can be hardcoded.
Building a Date Table Using Dates from a Fact Table – AKA a Dynamic Date Table
Using a date from an existing fact table can be a logical starting point for a date table. Most models only need dates captured in a dimension table as far back and/or as far forward as the facts being reported on. Because of the way we’ll build the date table with this approach, it’s a dynamic table. This means that as dates change in the fact table we use to get started, the date table will automatically adjust with each refresh. Here’s the typical steps I take when using this approach to build out a date table:
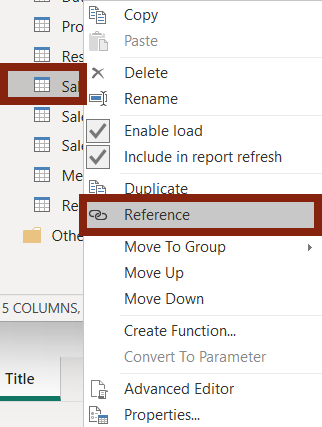
- Choose a fact table that contains dates. If multiple fact tables with dates exist, choose the one with the oldest date that you’d like to report on. Create a new query that references the selected fact table. To do this, right click on the fact table query and then left click “Reference”
- In the new query, remove all of the columns except the date column.
- Sort the date column in ascending order (oldest date first at the top of the column). We only need the first date in the column since it’s the oldest date in the fact table. This date will serve as the starting point of the date table is the only date that we need from the column.
- Drill down on the first “cell”. To drill down, right click on the first “cell” then left click “Drill down”. By drilling down, we are telling Power Query, “All I want is the data from the first row, nothing else.” At this point, the query should just contain a single date value.
- Give the query a meaningful name, such as MinDate. This query won’t be loaded into our data model, it’s just a harvester query that will remain in the background. The name only needs to be meaningful to you and/or other developers.
- Right click on the MinDate query and uncheck Enable Load to prevent this query from loading as a new table in the data model
- Create a new blank query. This is the beginning of the date table.
- Although we can use the UI to create most of the table, we’ll need to start with a little bit of M to create the column of unique date values.
- Open the Advanced Editor and enter the following script:
let
Source = List.Dates(MinDate, Number.From(Date.From(DateTime.LocalNow()) - MinDate), #duration(1, 0, 0, 0))
in
Source- This script is based on List.Dates() which has 3 required arguments: a start date, the number of dates that we want returned, and a date increment. In our example, the date returned in the MinDate harvester query is the start date. For the second argument, the script calculates the number of days between the start date and the current date returning dates through yesterday. Finally, the third argument tells the script to increment 1 day from the start date until reaching the number of dates in argument 2, giving us the column of sequential dates required in a date table.
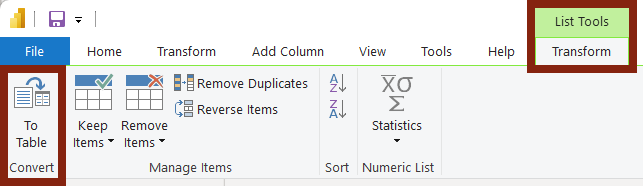
- Right now the query is a list. The difference between lists and tables in Power Query is out of scope for this article, but we need to convert the list to a table to load it into the data model. Convert the query from a list to a table by clicking “To Table” in the List Tools Transform tab. A popup window will appear, click OK to choose the default selections
- Give your new date column and date table friendly names
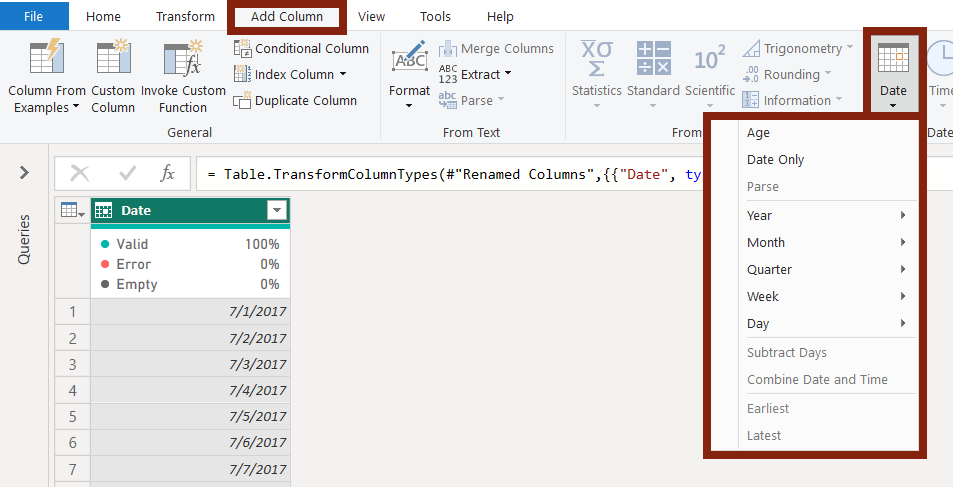
- With the Date column highlighted, click Add Column in the ribbon, and use the built in Date options to add the relevant columns for your model
- When complete, click “Close & Apply” to load your new date table!
Building a Date Table Using Hard Coded Dates – AKA a Static Date Table
There are a few less steps in creating a static table, but the steps are very similar to what’s used above.
- Create a new blank query. Since we’re not using an existing date from elsewhere in the model, we don’t need to harvest a date as the starting point.
- Open the Advanced Editor and enter the following script:
let
Source = List.Dates(#date(2012, 01, 01), 365, #duration(1, 0, 0, 0))
in
Source- This script is based on List.Dates() which has 3 required arguments: a start date, the number of dates that we want returned, and a date increment. In this example, the script starts on January 1st of last year and returns a list of 365 dates, specified in argument 2. Finally, the third argument tells the script to increment 1 day from the start date until reaching the number of dates in argument 2, giving us the column of sequential dates required in a date table. In this approach, you would need to enter the required date inside of the #date() function and the number of dates that you need returned in the list.
- Right now the query is a list. The difference between lists and tables in Power Query is out of scope for this article, but we need to convert the list to a table to load it into the data model. Convert the query from a list to a table by clicking “To Table” in the List Tools Transform tab. A popup window will appear, click OK to choose the default selections
- Give your new date column and date table friendly names
- With the Date column highlighted, click Add Column in the ribbon, and use the built in Date options to add the relevant columns for your model
- When complete, click “Close & Apply” to load your new date table!
In Closing
I trust that you can see Power QUery’s UI shine as you add new date columns to your table! To take your date tables even further, explore using the Date functions and Date/Time functions only available in M to do even more cool, nerdy stuff!
In the next article, we’ll jump to the Power BI report canvas and look at 3 quick tips to level up your visualization.