Ten years certainly is a worthy occasion for celebration! Power BI has come a long way in the last decade. As much as I’d like to just write some sentences recapping my favorite features, those words couldn’t encapsulate the importance of Power BI in my professional journey.
For me, this milestone represents more than a decade using a data analytics tool. It marks ten years since a significant career transition; one that I could not have anticipated bearing the fruit that it has today. In 2015, I was leaving behind a career in the music business, as an audio engineer, that I thought was my dream job. Like many in music, I struggled to make consistent money. So to help pay the bills, I was working for a small entry level IT firm just outside of Nashville, TN. Equipped with enough Excel knowledge to be useful, I produced fairly simple reports for my company. I enjoyed finding ways of making Excel formulas work for me so that I could focus on keeping up with the business. At the time, I simply wanted to use the tools at my disposal to make my company better and do my job more efficiently. I had no aspirations of journeying into the field of data or analytics.
But one day changed that. I remember it vividly. My boss, at the time, stepped into my office and said “Hey, I just got an email from Microsoft about this new software called Power BI. I think you should get it, you’d really like it. And it’s free.” When a boss makes a suggestion like that it’s usually a good idea to follow through on it. So I did. He had some data that he wanted to present in a meeting so he asked me to try out this new software to make a chart for him. So I enthusiastically opened up Power BI and proudly thought “how hard can this be?” What ensued was the creation of the worst and least communicative clustered column chart that has ever been made. It was so bad that my boss or I really had no idea what the chart was telling us. Needless to say, he was unable to use it in his meeting.
After attempting a couple iterations on the chart, I let my boss know that this new software made no sense to me and got back to work in Excel. The end…. just kidding. I don’t recall with clear detail what came next. But I remember that my boss wasn’t done with Power BI. And he didn’t think that I was either.
Every Friday morning I have coffee with “the guys”, the men I do life with. I recounted this story to them. One suggested that I check Meetup for any local Power BI or analytics groups. Perhaps there would be other folks out there who could help me. And sure enough I came across the Nashville Modern Excel and Power BI User Group. I signed up and attending my first meetup: a dashboard contest. The contestants mostly presented Excel dashboards but there was a Power BI entry. And it had charts that made sense, and told a story. I got a glimpse of the possibilities in Power BI. I met the organizer, Will Harvey, along with couple of the regular attendees. Finally, a little Power BI momentum.
I went back to the PUG the next month where Will did a presentation on DAX based on Rob Collie and Avi Singh’s book Power Pivot and Power BI. Another day that I remember vividly, as it’s quite possible that my brain has never hurt as much as it did that day. Will demonstrated how to use CALCULATE() to perform different time intelligence calculations, using a table to visualize the each step of the calculations broken down into bite sized pieces. What broke my brain was when he used ALL() within CALCULATE() to strip out the filter context when he put the measure on the visual – and every row returned the same result. “Why would you ever want to do that?!?!?!”, I perplexingly asked myself. Then Will showed how to use that measure as part of a ratio calculation. And it clicked. “If I’m going to learn Power BI, I need to learn this DAX.” Breakthrough.
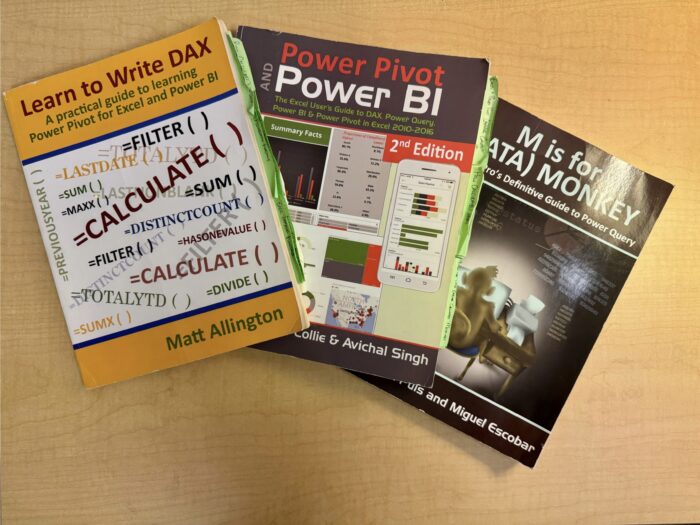
Upon my arrival back at the office that day, I went immediately to my boss’ office to report the breakthrough. I told him about Rob Collie’s book. And about Matt Allington’s Learn to Write DAX (there’s a newer version called Supercharge Power BI) and Ken Puls’ and Miguel Escobar’s M is for (Data) Monkey – books that Will also mentioned in his presentation. All three books were on my desk within a few days, along with the freedom to read them during business hours. I devoured these books. And by God’s grace, they made sense. Now I had traction.
I faithfully attended the Nashville PUG every month, where I got introduced to data visualization, ETL, T-SQL, SSAS, data storytelling, SQL Saturdays, and the vibrant data community. I was hooked. I met colleagues like Michael McKinley and Sekou Tyler, who I now get to serve as a co-leader with in the Nashville PUG. I Most importantly, I discovered where God was leading me for the next professional phase.
It wasn’t long until I moved on from the small IT firm to pursue Power BI as a full time job. And I have made a couple of job changes since that one. The community that I met at the PUG have been instrumental in helping me to get connected to each one of these roles. And instrumental in helping me be successful in them. Each one has provided opportunity to sharpen my Power BI skills.
While it’s God who deserves the glory for where I am today, it is significant how He used Power BI to get me here. Upon attending my first user group meeting, I never would have dreamed that I would become a leader in the community. I didn’t anticipate training in Power BI and DAX, or that Power BI would propel me to learn more about data engineering and data architecture. I never planned to write blog posts. But it’s the community that poured into me to help me get here and it’s my honor to pour back out to help others who today are in a place where I was ten years ago.
So, for me, celebrating ten years of Power BI is not just celebrating the growth of a tool I get to play with everyday. It’s as much celebrating the community, the personal growth, and realizing that the growth isn’t slowing down anytime soon!
But wait, there’s more!
I would be remiss to not mention a few favorites over the years. The short answer is, my favorite features have been any that have allowed more visual formatting. Custom themes was a big one. Custom tooltips. New DAX functions are always favorites too – like COALESCE(), REMOVEFILTERS() and many more. I loved the introduction of the ribbon chart, and I still like to use it today. And this Fabric thing looks pretty cool too 🙂